-
How to open an FBS account?
Click the ‘Open account’ button on our website and proceed to the Personal Area. Before you can start trading, pass a profile verification. Confirm your email and phone number, get your ID verified. This procedure guarantees the safety of your funds and identity. Once you are done with all the checks, go to the preferred trading platform, and start trading.
-
How to start trading?
If you are 18+ years old, you can join FBS and begin your FX journey. To trade, you need a brokerage account and sufficient knowledge on how assets behave in the financial markets. Start with studying the basics with our free educational materials and creating an FBS account. You may want to test the environment with virtual money with a Demo account. Once you are ready, enter the real market and trade to succeed.
-
How to withdraw the money you earned with FBS?
The procedure is very straightforward. Go to the Withdrawal page on the website or the Finances section of the FBS Personal Area and access Withdrawal. You can get the earned money via the same payment system that you used for depositing. In case you funded the account via various methods, withdraw your profit via the same methods in the ratio according to the deposited sums.
Chart patterns
Have you ever felt like the universe is trying to communicate with you by sending various warning signs? Sometimes these signs from the unknown sources help you escape serious troubles or prevent irreparable damage to your belongings. Not every person has a gift to decode the cryptic messages the universe is sending him. Not necessarily because of his/hers nihilistic and non-superstitious character, but because of the “language barrier” that stands between him/her and the universe. Once you learn the lingo of the universe, you become better armed against potential pitfalls that await you on your life journey.
FX market also has its own language. Traders who refuse to learn it suffer substantial financial losses being unable to recognize its warning signals. One of the key elements of FX language is chart patterns. In the following tutorial, you will learn them, and become well protected from unexpected treacherous trend reversals, false breakouts, extreme swings, and troughs.
Chart patterns are the combination of support and resistance lines which help to determine whether the trend will reverse or continue. As a result, there are reversal and continuation patterns.
Reversal chart patterns
Head and shoulders
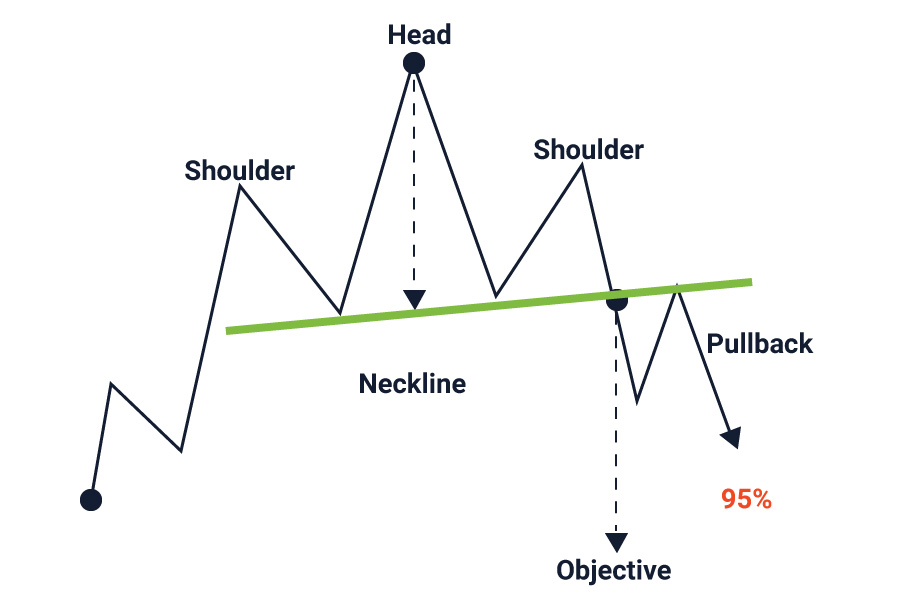
The head-and-shoulders pattern is usually formed at the end of an uptrend. While the bullish trend is seen as a period of successive rising peaks and rising troughs, the head-and-shoulders pattern illustrates a weakening in the trend.
The pattern consists of a head (the second and the highest peak) and 2 shoulders (lower peaks) and a neckline (the line which connects the lowest points of the two troughs and represents a support level). The neckline may be either horizontal or sloping up/down. The signal is more reliable when the slope is down rather than up.
The pattern is confirmed when the prices broke below the neckline after forming the second shoulder. Once it happens, the currency pair should start a downtrend. So, a sell order is put below the neckline. To get the target measure the distance between the highest point of the head and the neckline. This distance is approximately how far the price will move after it breaks the neckline.
Note that prices often return to the neckline after the initial breach (a “throwback” move). In this case, the neckline, which used to be a support, acts as resistance.
Read in detail how to trade with the Head and Shoulders pattern.
Inverse Head and Shoulders
The inverse head-and-shoulders pattern is the exact opposite of the head-and-shoulders. It occurs at the end of a downtrend and indicated a bullish reversal.
Double top
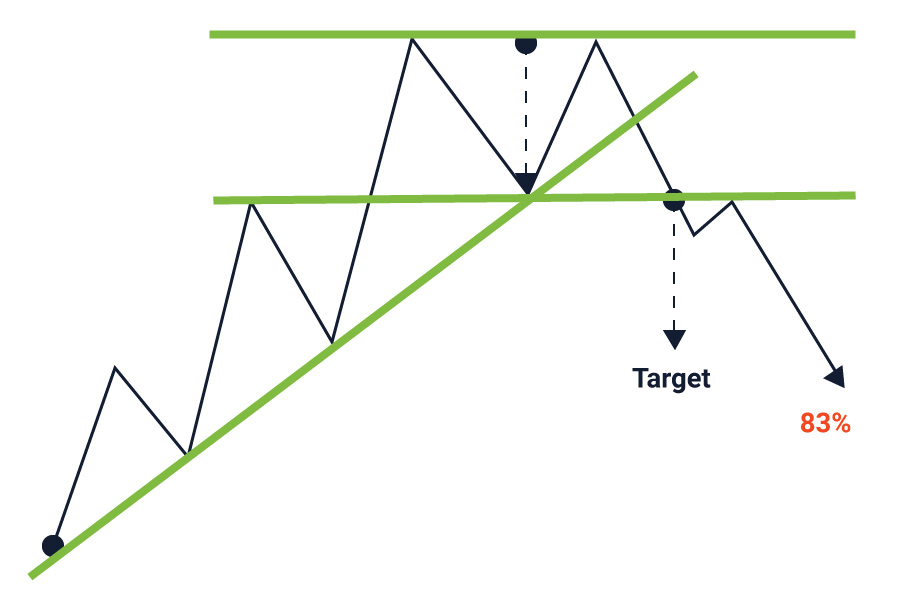
The double top is also usually formed at the end of an uptrend. It’s one of the most common formations. The pattern consists of two consecutive peaks of similar (or almost) height with a moderate trough between them. The neckline is drawn horizontally through the lowest point of a trough.
The pattern is confirmed when the prices break below the neckline after forming the second shoulder. Once it happens, the currency pair should start a downtrend. Put a sell order below the neckline. To get the target measure the distance between the peaks and the neckline. This distance is approximately how far the price will move after it breaks the neckline. Once breached, the neckline starts acting as resistance. Throwback move is also possible here.
Double bottom
The double bottom is the exact opposite of the head-and-shoulders. It occurs at the end of a downtrend and indicated a bullish reversal.
The similar patterns with 3 peaks/3 troughs are called Triple top/bottom. Trading should be the same.
Continuation chart patterns
Continuation chart patterns occur during a pause in the current trend and indicate that it will resume.
Triangles
Triangle patterns are easily recognized. The best way to trade them is to trade the breakouts. Trading inside the triangle is riskier and requires experience.
There are 3 types of triangle patterns. Ascending triangle is considered to be a bullish pattern, descending triangle – a bearish pattern, while symmetrical – a neutral one.
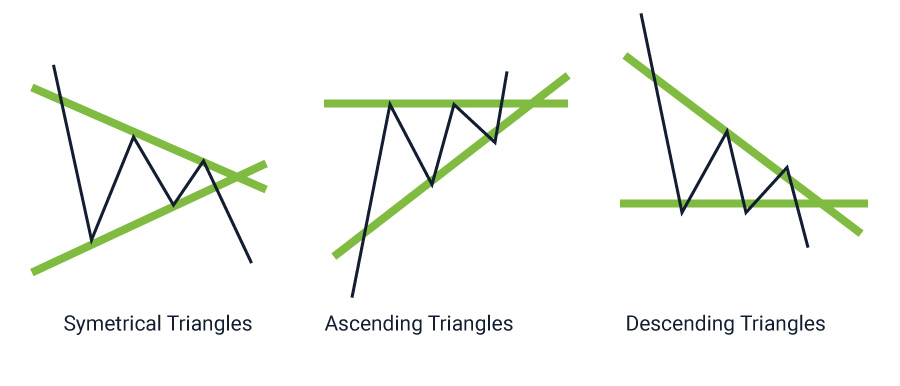
In the case of a symmetrical triangle, neither bull nor bears dominate the market. Support line slopes upwards and resistance line slopes downward at approximately one angle. The breakout may be in any direction. One sure thing is that it will eventually happen. As a result, one may place entry orders above the lower highs and below the higher lows. When one of the orders is hit, cancel the other.
The ascending triangle shows that the bulls are getting stronger as they manage to push the prices up to one level, while the Bears are weakening and allow the prices to form higher lows. Resistance line is relatively flat or horizontal and support line is sloping upwards. In most cases, but now always, the price will break out past the resistance. Set entry order above the resistance line and below the higher lows.
The descending triangle shows that the bears are getting stronger as they manage to pull the prices down to one level, while the Bulls are weakening and allow the prices to form lower highs. Resistance line is sloping downwards and a line of support that is relatively flat or horizontal. In most cases, but now always, the price will break out past the support. Set entry order below the support line and above the lower highs. Understanding triangle chart patterns
Flags and pennants
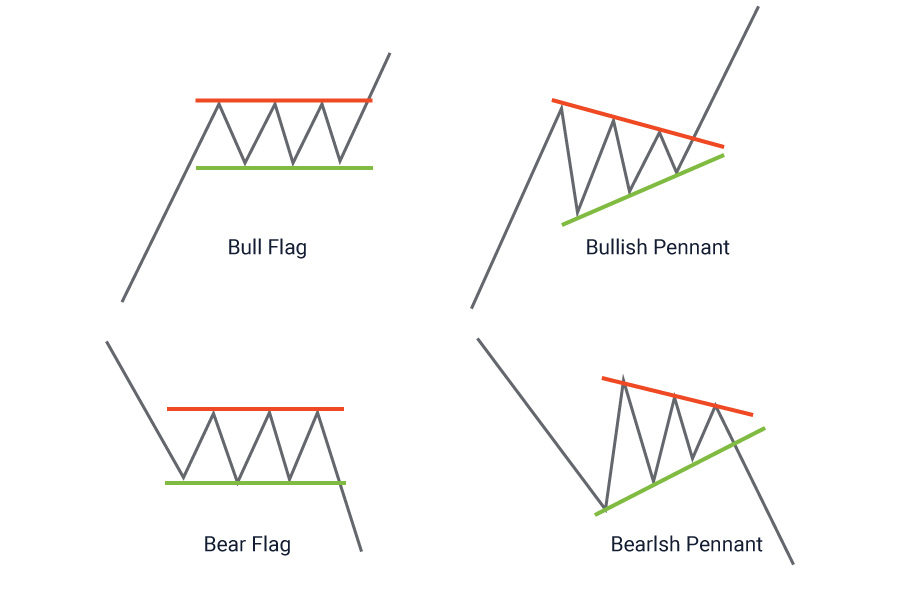
Pennants and Flags are short-term continuation patterns of which they are among the most reliable.
These patterns are formed when there is a sharp price movement followed by a consolidation phase. A flag consists of 2 parallel trendlines (support and resistance) that slope against the previous trend. A Pennant consists of two converging trend lines that begins wide and converges and is a very short term Symmetrical triangle.
Always trade Flag and Pennants in the direction of the previous trend placing orders above the resistance line (for uptrends) or support line (for downtrends).
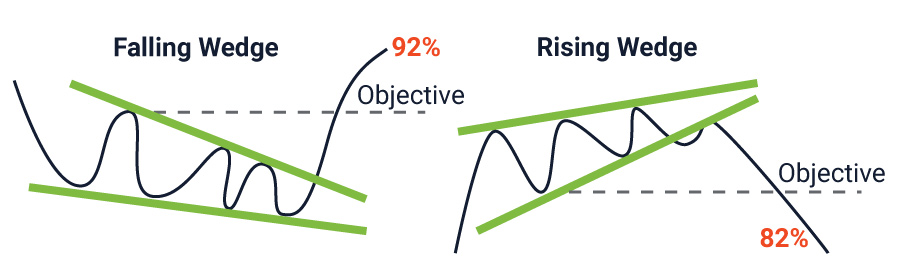
Wedges
Wedges are much similar to triangles.The difference is that wedges have a significant slope against the previous trend.
A rising wedge is formed when price consolidates between upward sloping support and resistance lines. If the rising wedge forms after an uptrend, it’s usually a bearish reversal pattern. If it forms during a downtrend, it could signal a continuation of the down move.
A falling wedge is formed when price consolidates between downward sloping resistance and support lines. If the falling wedge forms after a downtrend, it’s usually a bullish reversal pattern. If it forms during an uptrend, it could signal a continuation of the up move.
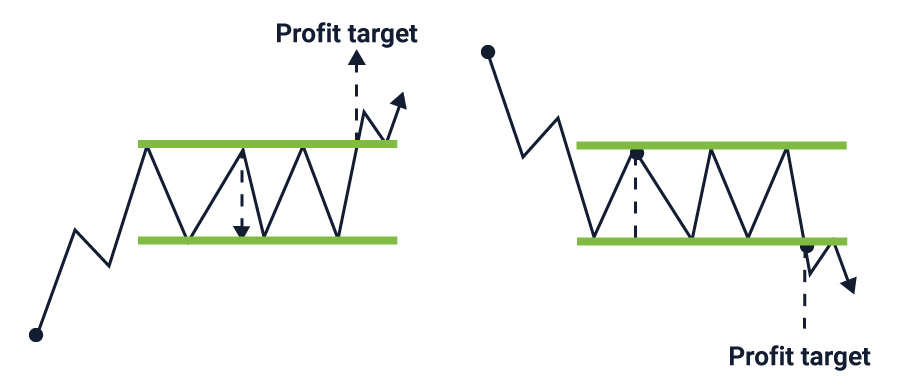
Rectangles
Rectangle describes a price pattern where supply and demand seem evenly balanced for an extended period of time The currency pair moves in a tight range, finding support at the rectangle's bottom and hitting resistance at the rectangle’s top. The prices will eventually break out of this sideways trade. The breakout will most likely be to the upside if the previous trend was bullish, and to the downside, if the previous trend was bearish. However, the rectangle can become a reversal pattern.

2023-05-25 • Updated
Other articles in this section
- Fibonacci fan
- Fibonacci expansion
- How to Use Fibonacci Retracements
- Reversal candlestick patterns
- Continuation candlestick patterns
- How to deal with market noise?
- How to backtest a trading strategy
- Gator Oscillator
- Market Facilitation Index
- Accelerator Oscillator
- Awesome Oscillator
- Ranges
- Alligator indicator
- Bill Williams theory
- Fractals
- Uncovering Gann indicators
- How to create your own trading strategy?
- Candlestick patterns
- Trend trading
- Carry trade
- Swing trading
- Position trading
- Day trading
- Scalping
- Fibonacci tools
- Trader's psychology
- How to identify market reversal
- Japanese Candlesticks
- Trends


