

US500: A further correction towards 5192 before resuming purchases.
Bearish Scenario: Sales below 5220... Bullish Scenario: Buys above 5225 (if price fails to break below decisively) ...
2022-12-15 • Updated
In December 2021, the main question on global markets was: “When will the FED increase the key rate?” Traders and investors were transferring their capitals into USDs, waiting for the great dump worldwide. Today, many of the “growth stocks” lost more than 50% from their highs. Since November, Bitcoin has plunged by 40%. The US indices are once again trading around the bottom border of the rising global channel.
Will this bearish trend continue, or have we already found the bottom for the next couple of months?
We believe that market members have overestimated tapering risks, and right now is the perfect moment to look for long traders in risk assets.
For example, according to the Fear & Greed index, Bitcoin has already found its global support. If you look at the picture below, you will realize Bitcoin reverses every time the crypto market’s F&G index hits 10.
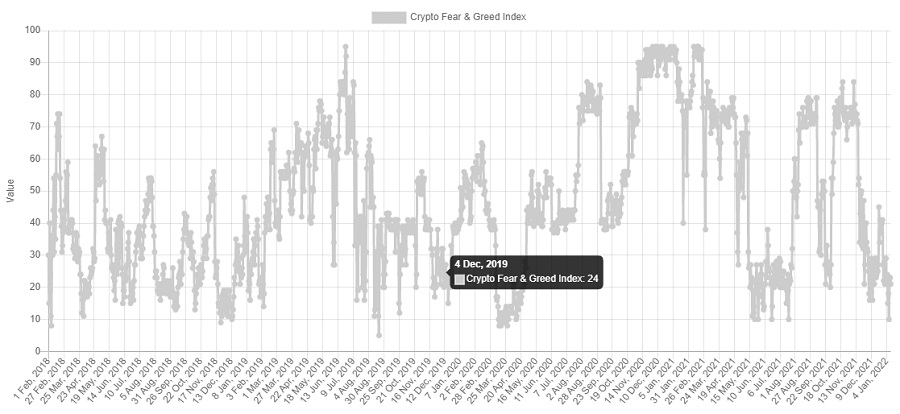
The Crypto market’s Fear & Greed index
Technical analysis
BTC/USD daily chart
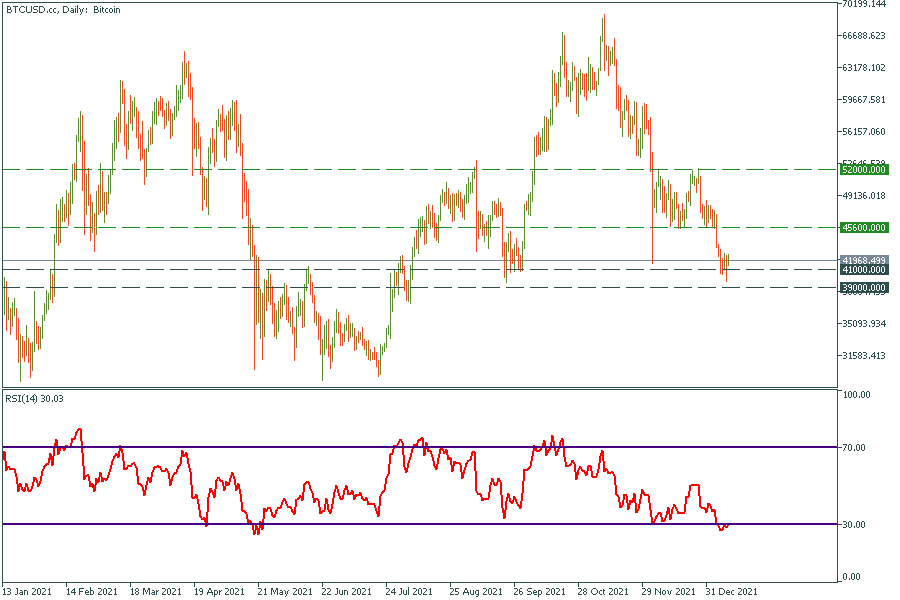
The price has reached a powerful range between $39 000 and $41 000. We can notice that the price has always reacted to these levels, so there is no doubt that the pullback will happen this time. The target for this movement is $45 600. Unfortunately, if bears can drag Bitcoin under $39000, the price will head towards $30 000.
US500 daily chart
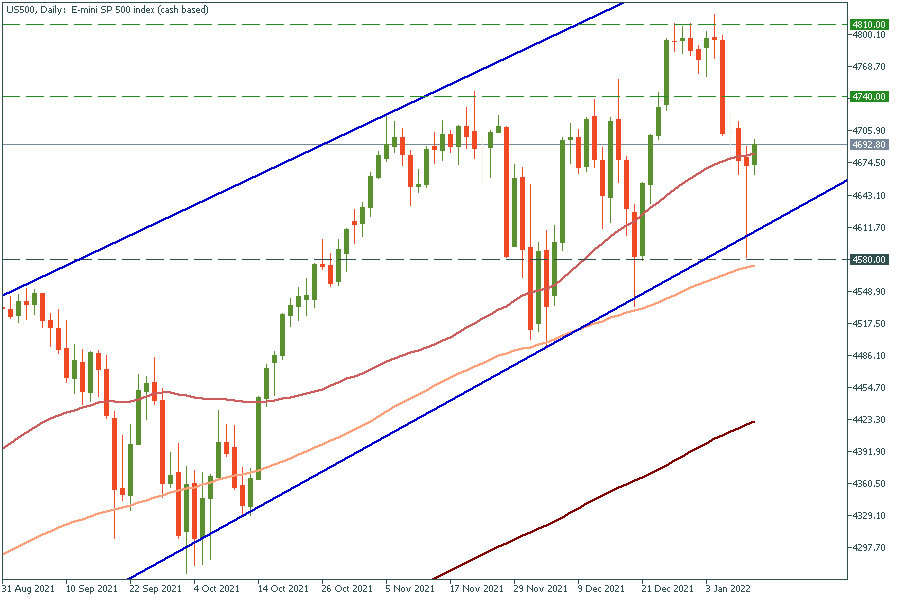
The US500 bounced off the bottom line of the global ascending channel again. The 100-day moving average is still an insurmountable barrier for sellers. We expect the US500 to renew its all-time high by mid-February. As soon as the price breaks through 4810, it will head towards 4870.
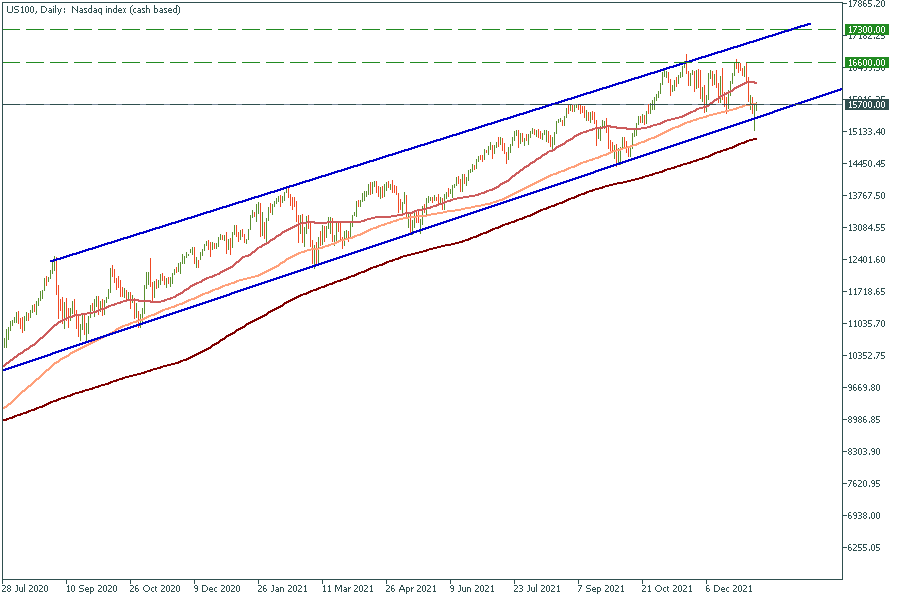
The US100 index has also bounced off the global trend line. The triple bottom pattern has appeared on the chart. As soon the price breaks through 16 600, it will reach 17 300.

Bearish Scenario: Sales below 5220... Bullish Scenario: Buys above 5225 (if price fails to break below decisively) ...

Bearish scenario: Shorts below 18100 with TP1: 17900... Anticipated bullish scenario: Intraday Longs above 18130 with TP...

Bullish Scenario: Buys above 17910 with TP:18098.07, TP2:18277, and TP3: 18415 Bearish Scenario: Sells below 17850 with TP1:17730, TP2: 17700
Jerome H. Powell, the Federal Reserve chair, stated that the central bank can afford to be patient in deciding when to cut interest rates, citing easing inflation and stable economic growth. Powell emphasized the Fed's independence from political influences, particularly relevant as the election season nears. The Fed had raised interest rates to 5.3 ...

Hello again my friends, it’s time for another episode of “What to Trade,” this time, for the month of April. As usual, I present to you some of my most anticipated trade ideas for the month of April, according to my technical analysis style. I therefore encourage you to do your due diligence, as always, and manage your risks appropriately.
Bearish scenario: Sell below 1.0820 / 1.0841... Bullish scenario: Buy above 1.0827...
FBS maintains a record of your data to run this website. By pressing the “Accept” button, you agree to our Privacy policy.
Your request is accepted.
A manager will call you shortly.
Next callback request for this phone number
will be available in
If you have an urgent issue please contact us via
Live chat
Internal error. Please try again later
Don’t waste your time – keep track of how NFP affects the US dollar and profit!
|


